What UV & PV Tell Us
Emily Parker
Product Engineer · Leapcell
In the realm of website operations and data analytics, PV and UV are two of the most fundamental and crucial metrics. They are not only the yardstick for measuring website traffic but also the cornerstone for gaining deep insights into user behavior and optimizing the product experience.
What are PV and UV?
- PV (Page View): This refers to the number of times a specific page on a website is clicked on or loaded by a user. Every time a user accesses a page, it is counted as one PV. For instance, if a user refreshes the same page multiple times in a short period, the PV count will increase accordingly. PV is a direct indicator of the overall traffic and popularity of a website.
- UV (Unique Visitor): This refers to the number of distinct users who visit a website within a specific time frame (usually a day). Regardless of how many times a user visits the site or how many pages they view within that day, they are counted as only one UV. UV measures the actual reach and audience size of a website.
A website with high PV and low UV might indicate that a small number of users are engaging deeply with the site, or it could suggest issues with the site's navigation design, causing users to refresh pages frequently. Conversely, a website with high UV demonstrates a broad audience, attracting a large number of different users.
What Analyses Can Be Derived from PV and UV?
Looking at PV and UV values in isolation has limited significance. However, by combining them and conducting cross-analysis with other data dimensions, highly valuable information can be unearthed:
Evaluating Content Popularity and Page Value
- High-PV Pages: By analyzing which pages have the highest PV, you can clearly understand what content users are most interested in, providing direction for content creation and operational strategies.
- Pages with a High PV/UV Ratio: This ratio represents the average number of times each unique visitor accesses a particular page. A high PV/UV ratio for a page could mean that users are very interested in its content and view it repeatedly. However, it could also imply design issues, such as information being difficult to find, leading users to refresh or return multiple times.
Gaining Insight into User Behavior and Engagement
- Average Page Views per Visitor (PV/UV): This is a core metric for measuring user stickiness. A higher PV/UV ratio generally means users spend more time on the site, have higher engagement, and are more interested in the content or services. Conversely, a low PV/UV ratio may indicate that most users leave after visiting just one page, resulting in a high "bounce rate."
- Visit Depth Analysis: By analyzing user navigation paths—which page they enter from and which pages they navigate to—you can map out user behavior journeys. Combined with PV data, this allows you to identify core user paths, providing a basis for optimizing website navigation and internal linking.
Measuring the Effectiveness of Marketing Campaigns
- Campaign Page UV and PV: During marketing promotions, you can quickly assess a campaign's effectiveness by monitoring the UV and PV of the campaign page. UV reflects the campaign's reach and appeal, while PV indicates its overall popularity.
- Traffic Source Analysis: By analyzing PV and UV in conjunction with traffic sources (such as search engines, social media, ad placements, etc.), you can determine the effectiveness of different channels. For example, if an advertising channel brings in a high UV but a very low PV/UV ratio, it suggests that the attracted users are of low quality, and the advertising strategy needs adjustment.
Identifying Potential Website Issues and Optimization Opportunities
- Low-PV Pages: For pages with extremely low PV, it's necessary to analyze the cause. Is the content quality poor, or is the entry point too deeply buried for users to discover? This can help in content optimization or website structure adjustments.
- Abnormal Traffic Fluctuations: By monitoring long-term trends in PV and UV, you can promptly detect unusual fluctuations. For example, a sudden surge in PV might not be a good thing and requires investigation into whether it's due to malicious attacks (like click farming). On the other hand, a continuous decline in UV is a warning sign that prompts a review of potential problems with the product or market strategy.
Interesting Points About User Visit Data
Data can also be deceptive because the actual situation sometimes differs from the collected values.
A User's IP Does Not Represent Their Real IP
Often, the user IP address recorded by a website's backend is not the user's true IP. This is typically because the user's request first reaches a "gateway" service. A Gateway is a special service that sits between the user and the actual web server. It serves various purposes, such as intercepting malicious requests, distributing traffic to different backend servers, and logging user access.
When a user's request passes through a gateway, the web server interacts directly with the gateway. Therefore, the IP address recorded in the server logs is often the IP of the gateway.
To solve this, when the gateway forwards the request to the backend server, it usually adds an HTTP header field called X-Forwarded-For. This field records the user's real IP address.
Therefore, for accurate user source analysis, it is essential to check and use the IP in the X-Forwarded-For field to obtain the user's true IP address.
A User's IP Does Not Represent Their Real Location
Even if you obtain the user's real IP, it doesn't guarantee a 100% accurate determination of their geographical location. There are two main reasons for this:
- Use of VPNs and Proxies: For privacy protection or other reasons, many users utilize VPNs to hide their real IP. In such cases, the geographical location obtained from the IP address is actually the location of the VPN server, not the user's true location.
- Limitations of IP Databases: We typically rely on third-party IP geolocation databases like MaxMind to analyze the location of an IP. However, these databases may have update delays, and their coverage is not always 100% comprehensive or accurate.
To more accurately determine a user's location, we can employ cross-validation methods. For example, we can use the timezoneOffset provided by the browser. The timezoneOffset is obtained via JavaScript and represents the difference in minutes between the user's browser time zone and UTC.
Since users' computer clocks are usually set to their local time, the timezoneOffset can often reflect the user's region more reliably than their IP address.
By comparing the geographical location derived from the IP address with the time zone reflected by the timezoneOffset, the accuracy of the location determination can be significantly improved. For example, if an IP address indicates it is from the US West Coast, but its time zone offset corresponds to Eastern Europe, it is highly likely the user is using a VPN.
Cleaning and analyzing data like PV and UV is a tedious but important task. Fortunately, platforms like Leapcell have already taken on this job.
In addition to being a web app deployment platform, Leapcell comes with out-of-the-box PV and UV traffic recording and analysis features to monitor the performance of deployed projects. Developers no longer need to build a traffic analysis system from scratch.
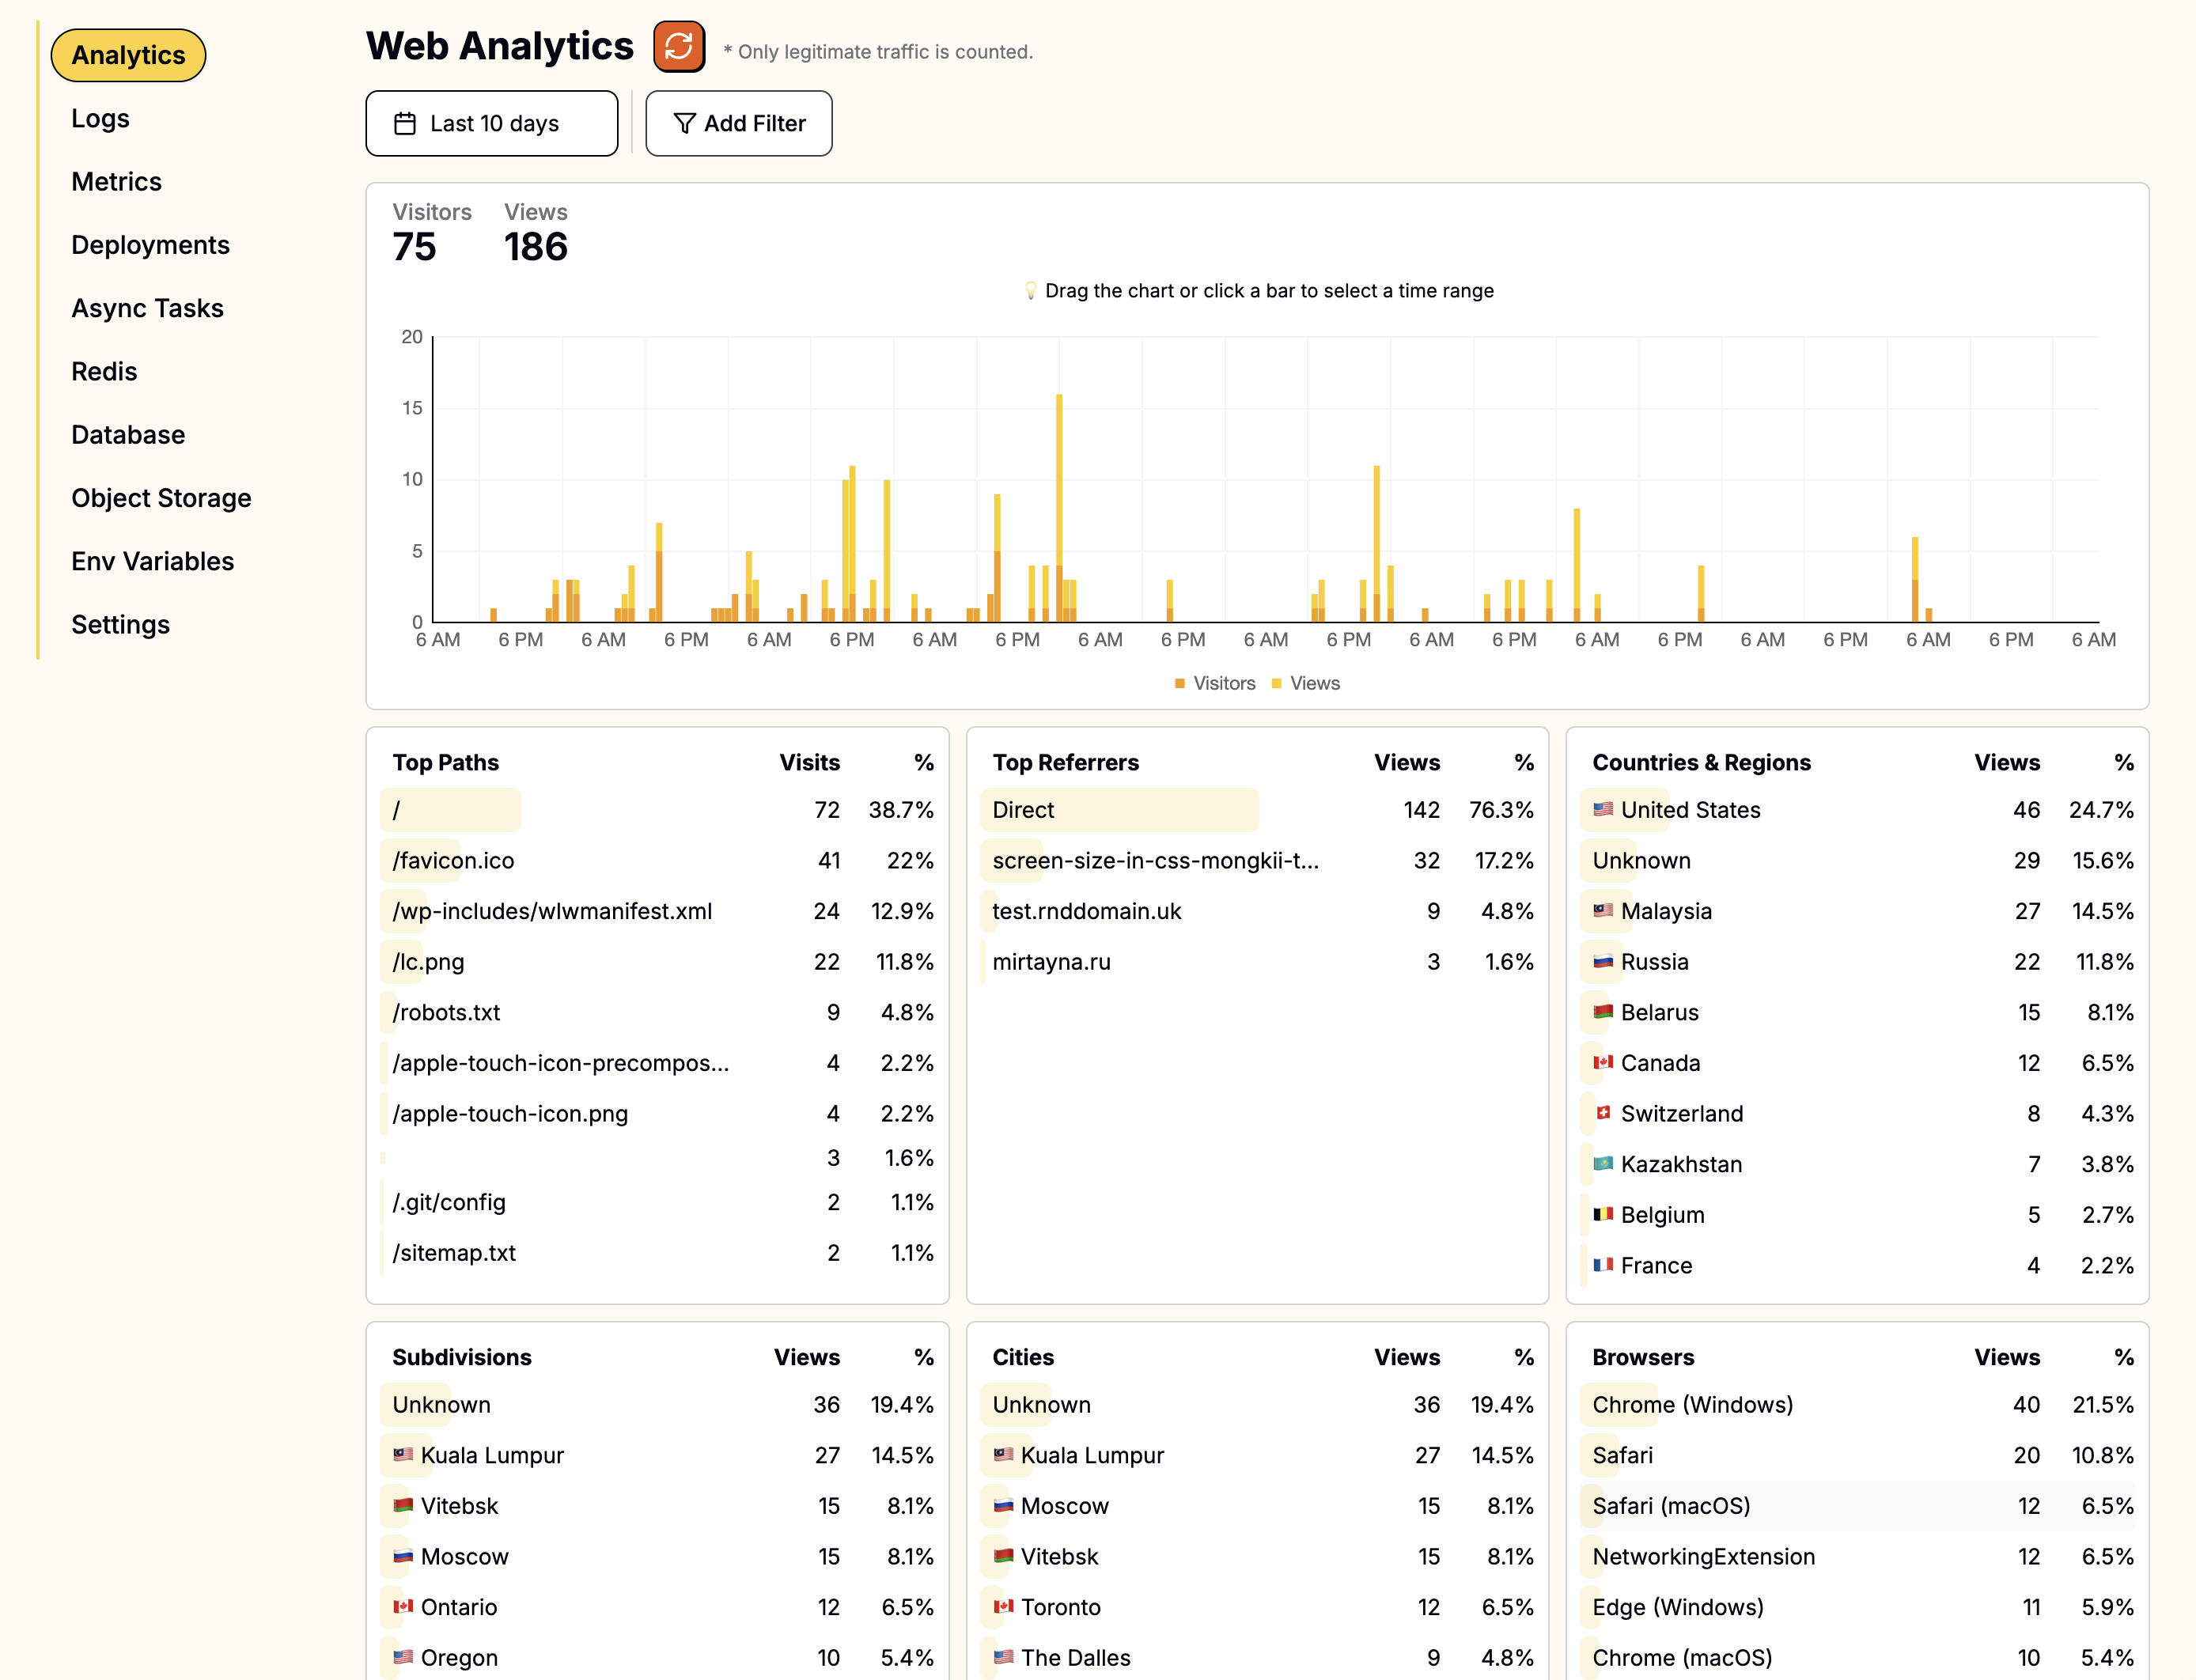
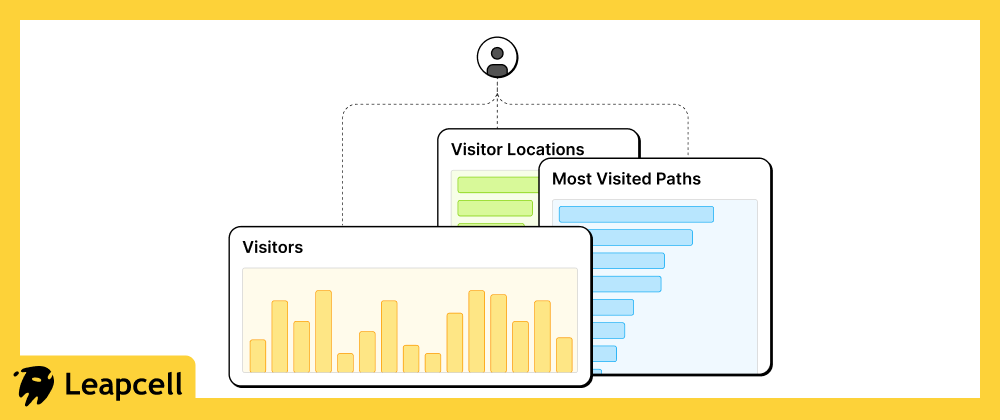
Leapcell's traffic analysis can provide you with these insights:
- Real-time PV and UV statistics
- The most popular and most visited website pages (paths)
- The country and region of visitors
- The browsers and userAgents used by visitors
Try Leapcell now to experience the power of built-in visitor analytics and let data drive your product's growth!
